
Cart abandonment metrics are critical performance indicators for e-commerce operators. While abandonment itself is unavoidable, understanding its dimensions allows digital marketers, analysts, and store owners to optimize revenue recovery, prioritize UX investments, and refine marketing attribution. This article unpacks the cart metrics that matter and provides actionable benchmarks to evaluate your checkout funnel. Once these metrics are understood, we’ll also explore how solutions—such as Wallid—can support your optimization efforts.
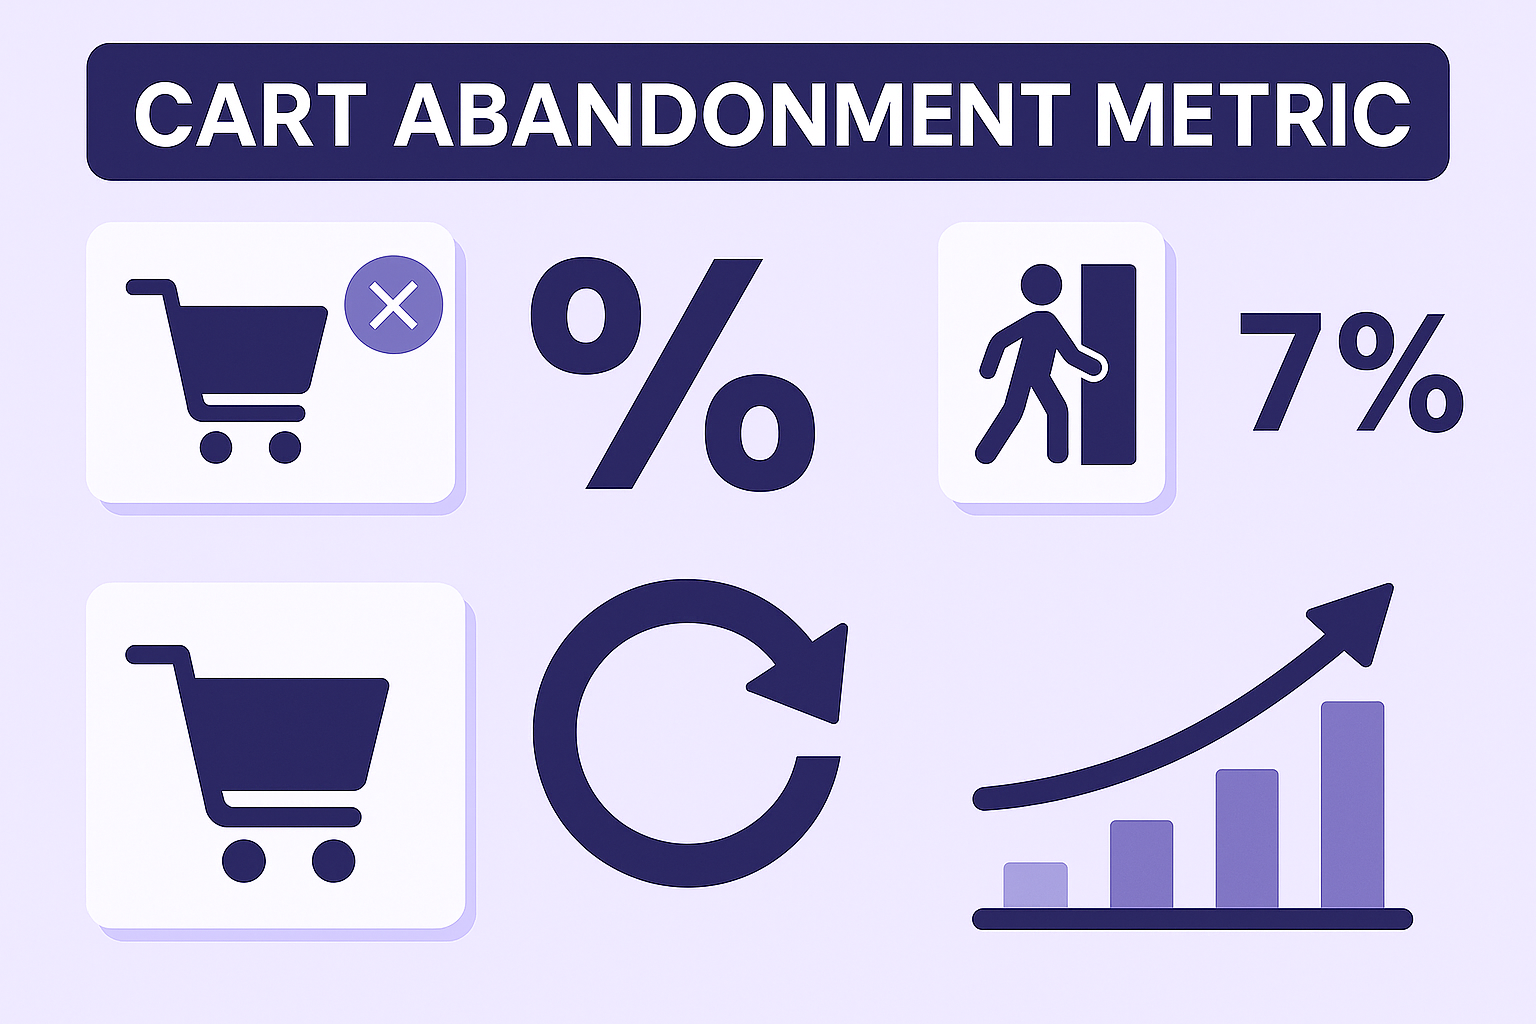
Key Cart Abandonment Metrics to Track
1. Cart Creation Rate
This measures how well your site drives intent. A high session count with a low cart creation rate signals disconnect between browsing and product confidence.
This measures how well your site drives intent. A high session count with a low cart creation rate signals disconnect between browsing and product confidence.
Track this rate across acquisition channels to identify underperforming traffic sources or landing pages.
2. Cart Abandonment Rate
This is your macro conversion signal, indicating how many users start the process but leave before purchasing.
This is your macro conversion signal, indicating how many users start the process but leave before purchasing.
While the percentage provides an overall health check, tracking it over time can reveal the impact of UX or pricing changes.
3. Checkout Abandonment Rate
This narrows focus to users who begin but don’t complete the checkout flow.
This narrows focus to users who begin but don’t complete the checkout flow.
It’s especially useful if your store separates the cart and checkout steps.
4. Exit Rate on Cart Page
This metric tracks how often users exit your site from the cart page, before they ever initiate checkout.
This metric tracks how often users exit your site from the cart page, before they ever initiate checkout.
High exit rates here could suggest surprises (like taxes or shipping fees) or distractions.
5. Cart Recovery Rate
This reflects the effectiveness of your follow-up efforts—email, SMS, push notifications, or ads—in recovering abandoned carts.
This reflects the effectiveness of your follow-up efforts—email, SMS, push notifications, or ads—in recovering abandoned carts.
Monitor this to benchmark the ROI of your retargeting and automation strategies.
Cart Abandonment Benchmarks
According to Baymard Institute, the average cart abandonment rate is around 70.19%, but interpretation depends on context:
Comparing your performance by device and channel will help you identify gaps and opportunities.
Visualizing and Acting on Metrics
Once you have a clear picture of your abandonment metrics, tools like Wallid can help you move from insight to action:
By combining detailed metrics with Wallid’s automation and personalization tools, you can create recovery strategies tailored to user behavior and intent.
- Behavioral Tracking: Monitor cart and checkout abandonment in real time across all devices.
- Segmentation: Break down abandonment data by user cohort, traffic source, and product type.
- Automated Recovery: Deploy dynamic emails, SMS, or WhatsApp messages based on user behavior.
- Exit Intent Engagement: Use prompt-based engagement to retain users before they leave.
- Funnel Reporting: Identify bottlenecks in the user journey with visual dashboards.
By combining detailed metrics with Wallid’s automation and personalization tools, you can create recovery strategies tailored to user behavior and intent.
