Blog

Where Cart Abandonment Happens Most

Illustration showing where cart abandonment happens most in ecommerce, with three bar charts comparing drop-off rates by device, funnel step, and traffic source, alongside a mobile screen displaying an empty shopping cart with a cancel icon
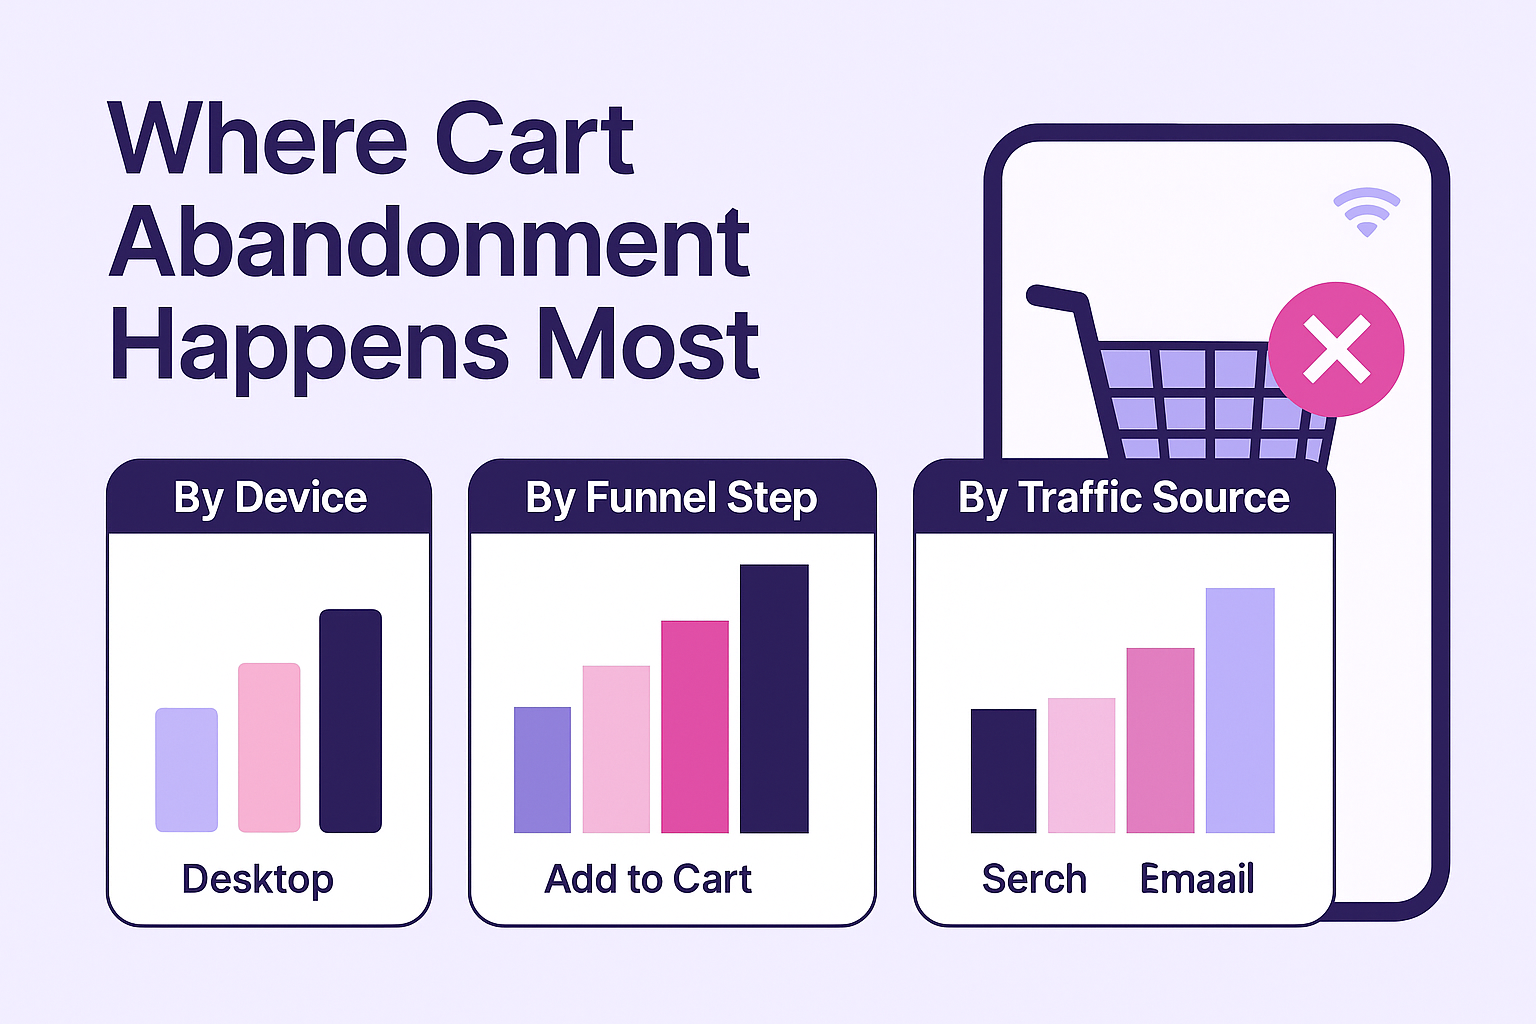
Shoppers abandon their carts for many reasons, but knowing exactly where they drop off helps you fix what matters most. In this article, we’ll break down abandonment trends by device type, traffic source, and funnel step, so you can reduce funnel drop-off and turn browsers into buyers.

Key Takeaways:

  • Mobile users abandon carts significantly more than desktop users due to higher friction.
  • The payment step is where the most funnel drop-off occurs, often due to poor UX or trust issues.
  • Traffic source affects abandonment rates—email and organic visitors convert better than paid or social traffic.
  • Analyzing drop-offs by device and funnel step helps prioritize impactful fixes.

Where Cart Abandonment Peaks

In e-commerce, a "funnel" represents the sequence of steps a shopper takes on their way to making a purchase, from browsing products to completing a transaction. Each stage in the funnel is an opportunity to either move forward or drop off. Funnel drop-off is when users exit the site during one of these key stages, before completing their purchase. Identifying where and why this happens helps businesses pinpoint friction points and improve conversions.

1. By Funnel Step

Understanding the customer journey is crucial to pinpoint where abandonment occurs. While every step matters, some stages are significantly more prone to drop-offs.
Funnel Step Avg. Drop-off Rate Common Issues
Product View 10–20% Low-quality images, unclear benefits
Add to Cart 20–30% Hidden costs, no trust badges
Checkout Start 40–50% Required logins, lack of guest checkout
Payment Stage 60–80% Poor mobile UI, long forms, no PayPal
Tracking drop-off across funnel steps helps you locate and fix friction before it kills conversions.
The payment stage is the most critical point in the funnel. It’s where intent collides with hesitation. Long or confusing forms, missing trust signals, or a lack of preferred payment methods can easily derail conversions. Streamlining this step is one of the most impactful optimizations you can make.

2. By Device Type

Not all users experience your site the same way. Device type plays a massive role in shaping how users interact with your store and whether they complete a purchase.
  • Mobile: 85% abandonment rate
  • Desktop: 68% abandonment rate
  • Tablet: 75% abandonment rate
Mobile shoppers dominate traffic, but they also face more friction. Smaller screens, less accurate inputs, and slower loading times often combine to push users away. This makes mobile UX design one of the top priorities for reducing abandonment. Responsive design, sticky CTAs, quick payment options, and lightning-fast load times all matter.

3. By Traffic Source

Traffic source reveals how primed a visitor is to buy. The further a user is in their intent journey, the less likely they are to abandon.
Traffic Source Abandonment Rate Notes
Organic 63% Warmer leads, lower bounce
Paid Search 78% High expectations, less patience
Social Media 84% Distraction-prone, lower purchase intent
Email 59% Pre-qualified and high intent
Your traffic source influences buyer intent—optimize the best performers and adjust strategies for cold traffic.
Email and organic traffic consistently perform better because users arrive with a purpose. In contrast, users from social media or display ads may be curious but uncommitted. Tailor your landing pages and retargeting strategy according to each source’s behavior to minimize drop-off.

How to Act on This Data

Improving funnel performance isn’t just about fixing obvious bugs—it’s about anticipating where users might hesitate or lose trust, and proactively smoothing those steps. Here’s how to use the insights above:
Once you know where abandonment happens, the next step is to act on those insights:
  1. Optimize the payment step with one-click options and fewer form fields.
  2. Prioritize mobile UX with responsive design, autofill, and intuitive navigation.
  3. Match content to traffic source so expectations align with your landing page.
  4. Monitor device analytics regularly to catch drop-offs early.
  5. A/B test funnel changes and iterate based on performance data.
Small wins at high-drop-off points can lead to big gains in revenue.

Want help reducing drop-off across devices and funnel steps?

WalliD helps merchants track abandonment in real time and optimize every step of the funnel—from product view to payment.

Want to fix funnel drop-off and boost conversions with better device and traffic insights?

Speakable Summary

This article breaks down where cart abandonment happens most—across funnel steps, device types, and traffic sources. It helps eCommerce teams reduce drop-off and prioritize optimizations using real data.

How to Improve Mobile Conversion on Shopify

  1. Use a mobile-optimised, responsive Shopify theme like Dawn or Sense.
  2. Simplify your forms by asking only for essential information (e.g., name, email, shipping).
  3. Ensure all buttons and CTAs are large, spaced, and thumb-friendly.
  4. Test your store on real devices (not just emulators) for friction points.
  5. Remove pop-ups, overlays, or banners that interrupt mobile flow.

FAQ

Why do mobile users abandon carts more?

Mobile shoppers face friction from small screens, difficult navigation, slow loading times, and clunky forms—causing abandonment even when purchase intent is high.

Which funnel step has the highest abandonment?

The payment stage sees the most drop-off, often due to security concerns, long forms, unexpected fees, or lack of preferred payment options.

How can I reduce cart abandonment on mobile?

Optimize mobile UX with faster load speeds, autofill, guest checkout, and simplified forms. Make navigation and purchasing intuitive on smaller screens.

Does the traffic source impact abandonment?

Yes. Visitors from email and organic search are more likely to complete purchases than users from paid ads or social media, who often lack strong intent.

What role does trust play in abandonment?

Shoppers often abandon at checkout if trust elements like SSL badges, secure payment logos, or verified reviews are missing.

How can I identify where users drop off?

Use funnel analytics tools like Google Analytics or session replays to pinpoint the exact steps where users abandon their journey.

Should I offer guest checkout?

Yes. Requiring account creation increases friction. Guest checkout speeds up the process and reduces abandonment.

Do shipping costs affect abandonment?

Unexpected or high shipping fees are a leading cause of cart abandonment. Be transparent or offer free shipping thresholds to counteract this.

Can retargeting help recover lost sales?

Yes. Use retargeting ads, cart recovery emails, or exit-intent popups to bring back users who abandoned before purchasing.

Expert Note:
Written by a Wallid Content Intern focused on shopper psychology, funnel analytics, and device behavior. This article is part of Wallid’s cart abandonment support series—designed to help merchants understand and fix drop-off with data-driven strategies.